
Ask five reference books for Camaro production numbers by year and you will usually get five answers that agree on most years and quietly part ways on a few. That is normal. The figures below run from the first 1967 cars to the last 2002 coupes and convertibles, and for every year where the published sources split, the split is shown rather than smoothed over. If you are here because a car is on your lift, the Camaro restoration basics cover the work; this page covers the count.
Car Features
7 min read
Classic Camaro Production Numbers, 1967 to 2002
Camaro production numbers by year from 1967 to 2002, with every year where the sources disagree shown, plus the record, the lows and generation totals.
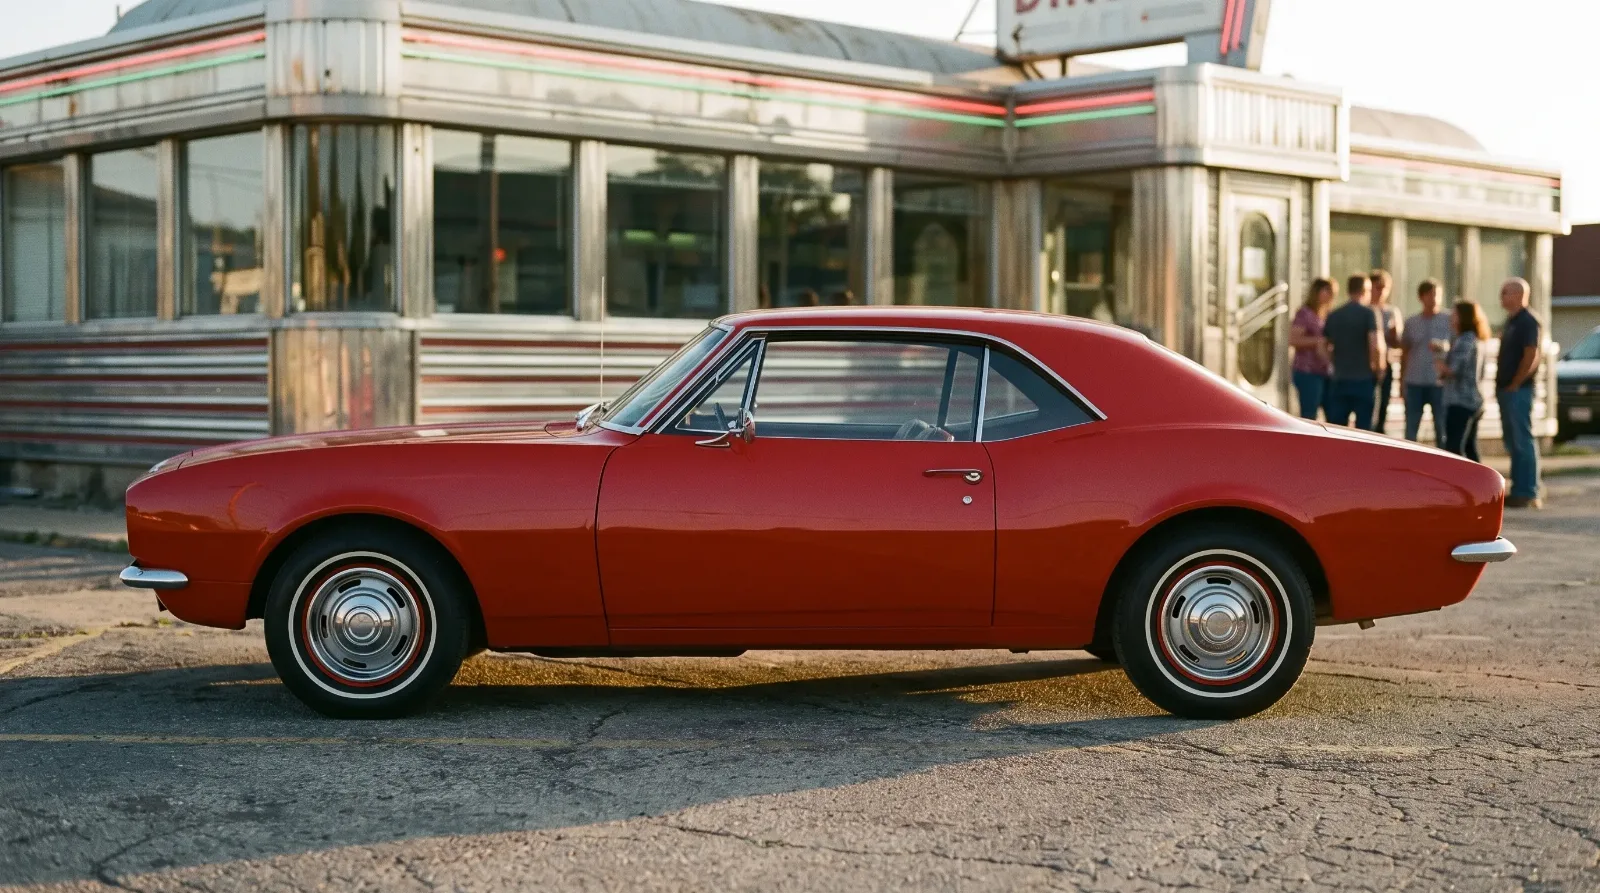
Why every Camaro production figure is an estimate
Start with the admission that the most widely reprinted table makes about itself. Classic Industries labels its 1967 to 2002 production list "estimated" and notes that even Chevrolet does not know exactly how many Camaros were delivered. That is not false modesty. Production was tallied from plant records, invoices and later reconstructions, and each compiler made choices about what to count.
Three choices explain most of the disagreement. The first is model year against calendar year: a model year can start months before January and end months after December, and a sales figure for a calendar year is a different animal from a build count for a model year. The second is domestic against total. One source gives 1974 as 146,595 domestic cars plus 4,142 for export, which comes to 150,737, while the usual total is 151,008. The third is market. The 42,098 that some sources print for 2002 traces back to a page describing cars "built for the United States", and the same 42,098 also turns up as the 1999 total in two other sources, which makes its use for 2002 suspect.
None of this makes the numbers useless. It means the last three digits deserve less confidence than the first three, and a figure quoted without its source deserves less still.
Camaro production numbers by year, 1967 to 2002
The middle column is the figure this table uses, chosen where several independent sources agree. The right column shows where at least one source prints something else. Where no column note appears, no conflicting figure turned up.
| Model year | Figure used | Where sources split |
|---|---|---|
| 1967 | 220,906 | No conflict found |
| 1968 | 235,147 | No conflict found |
| 1969 | 243,085 | One profile site: 230,799 |
| 1970 | 124,901 | Four sources agree; one gives 117,604 |
| 1971 | 114,630 | Four sources agree; one gives 107,496 |
| 1972 | 68,656 | Others: 68,651 and 68,671 |
| 1973 | 96,751 | Others: 96,756, 96,571 and 89,988 |
| 1974 | 151,008 | 146,595 domestic plus 4,142 export |
| 1975 | 145,770 | One source: 141,629 |
| 1976 | 182,959 | No conflict found |
| 1977 | 218,853 | No conflict found |
| 1978 | 272,631 | No conflict found |
| 1979 | 282,571 | One source: 282,582 |
| 1980 | 152,005 | No conflict found |
| 1981 | 126,139 | Two sources: 126,138 |
| 1982 | 189,747 | Others: 189,735 and 182,068 |
| 1983 | 154,381 | Digit-swapped 153,831 and 154,831 |
| 1984 | 261,591 | One source: 261,108 |
| 1985 | about 180,000 | 180,018 against 179,814 |
| 1986 | 192,219 | Also printed as 192,128 |
| 1987 | 137,760 | No conflict found |
| 1988 | 96,275 | No conflict found |
| 1989 | 110,739 | No conflict found |
| 1990 | 34,986 | One table: 83,089; one estimate: 35,000 |
| 1991 | 100,838 | No conflict found |
| 1992 | 70,007 | No conflict found |
| 1993 | 39,103 | One estimate: 40,224 |
| 1994 | 119,799 | One estimate: 125,244 |
| 1995 | 122,738 | Two sources: 122,725 |
| 1996 | 61,362 | One source: 63,772 |
| 1997 | 54,972 or 60,202 | Unresolved; two sources lean 54,972 |
| 1998 | about 48,000 to 49,000 | 48,495, 49,218, 48,490, 47,218; one source: 54,026 |
| 1999 | 42,098 | One source: 46,105 |
| 2000 | 45,461 | All three sources agree |
| 2001 | 29,009 | One source: 35,341 |
| 2002 | 41,776 | Others: 42,098 |
Add the chosen figures and the first generation comes to 699,138, the second to 1,936,874, the third to 1,528,561 and the fourth to 604,813 (using 54,972 for 1997 and 48,495 for 1998). That puts the classic run at about 4.77 million cars. Treat the generation totals as sums of estimates, not as factory statements. Another widely used third-generation table totals 1,567,657, because its yearly figures differ in several years, and one fourth-generation count gives 633,196 Camaros, while a Hagerty writer settled for "more than 600,000". The honest fourth-generation answer is somewhere between about 605,000 and 633,000.
Where the sources disagree, and how to read the gaps
Most conflicts are small and boring. A one-unit gap in 1981 or an 11-unit gap in 1979 looks like a typo and changes nothing about how rare or common a car is. The 1983 figures are a good example of how these errors breed: 154,381, 153,831 and 154,831 use the same digits in a different order. An engine split of 9,926 four-cylinder, 54,332 V6 and 90,123 V8 cars sums to 154,381, which is why that version is used here.
A few conflicts are large enough to matter. The 1990 model year is the clearest. One widely copied table prints 83,089, yet the same source's own text says about 35,000, and a separate figure puts 1990 at about 32 percent of 1989. The 1990 cars were built for only about August to December 1989, so 34,986 fits the calendar and 83,089 looks like a mislabel.
The fourth generation is where the sheet gets thin. For 1997 the gap is more than 5,000 cars between 54,972 and 60,202. For 1998 there are four different figures from four sources, possibly a United States against total split, and no primary GM number has been found to settle it. Print a range for 1998 and say so. One compiler's figures for 1973 to 1975 run consistently low against everyone else, which points to a different counting basis rather than random error.
The highs, the lows and what moved them
The record is 1979, at 282,571, the highest of any Camaro model year. The second generation as a whole was the volume era, and 1978 at 272,631 was not far behind. The third generation peaked in 1984 at 261,591, a figure that is the highest third-generation year in every source consulted.
The lows each have a reason you can name. In 1972 a UAW strike at Norwood disrupted production for 174 days, and 1,100 unfinished Camaros were scrapped because they could not meet the 1973 bumper standards; the year closed at 68,656, the lowest of any model year before 1990. The 1970 total of 124,901 reflects a late start, with build data reaching the plants in February 1970. The 1969 total of 243,085 is swollen for the opposite reason, by the extended run, with Van Nuys building 31,163 and Norwood 211,922. The 1990 dip is the short model year, and 2001, at 29,009, is the lowest Camaro model year of the whole 1967 to 2002 run, below even the short 1990 year.
For the context behind those swings, the strikes, the plant moves and the shifts in what buyers wanted, the whole story covers the model from launch to the 2002 finish. The Camaro returned for 2010, after the last fourth-generation car was built on 27 August 2002.
"A production figure is a count somebody made from records somebody kept. I respect the first three digits and keep a little suspicion for the rest."
Tom Ramirez
What production totals tell you about a single car
Less than people hope. A total of 243,085 says 1969 was a big year; it says nothing about your car. The numbers that matter to a buyer sit one level down, in option and model counts, and those are where the disputes get sharper because the samples are smaller. The first-generation Z28 went from 602 cars in 1967 to 7,199 in 1968 and 20,302 in 1969, and those figures are well supported. Others are not. The 1996 SS has been counted at 2,257, 2,263, 2,269 and 2,410 depending on whom you ask, and the 1988 1LE is either six cars or about four.
Use the totals as context and the paperwork as evidence. A low production number makes a car worth faking, which is where the line between a clone and a tribute matters, and you can read more here.
Rarity claims get tested hardest on first-generation cars, where options were ordered one box at a time and trim and cowl tags carry the evidence. If you are taking one apart, first-gen restoration basics is the place to start. The production table tells you how many were built. Only the paperwork on the car tells you which one you have.
Sources and notes
- 1967 to 2002 Camaro generations production numbers, Classic Industries
- First-generation Camaro general information and plant production, Camaro Research Group
- Your handy 1970 to 1981 Chevrolet Camaro buyer's guide, Hagerty
- Guide to the third-generation Chevrolet Camaro, GM EFI
- Fourth-generation F-body values and production, Hagerty
- Chevrolet Camaro production by model year, Wikipedia
Related Reading
Have a
Chevrolet Camaro
for Sale?
Reach thousands of serious classic car collectors across the US.
Sell It Here →
Selling a classic? Here's how: the best sites to sell a classic car
Are You a Classic Car Dealer?
List your full inventory and connect with targeted classic car buyers.
Join as a Dealer →
#camaro history
#chevrolet camaro
#camaro restoration
#classic camaro
#camaro production
#classic car values

About the author
Tom Ramirez
Corvette researcher and historian based in Bowling Green, Kentucky. Two decades documenting Corvette production history from original factory records.
Related Listings - Chevrolet Camaro

Comments
Be the first to comment on this article.